Facial Biotype is not at all a subjective concept
This document is part of the Orthoprogressive resource set to support academic training aimed at improving and expanding perspectives and practices. Find the other resources in this set here. Thanks to the volunteers from the Bioprogressive community who previously supported me in structuring the Orthoprogressive project. It is also available in French and Spanish.
Improving assessment practices and research in academic development requires the ability to analyze and quantify results. The concept of facial biotype tends to be as simple as classifying a long face or a wide face according to the perspective of the clinician observer. In our practice facial biotypology is a measurable concept based on statistics, being of critical importance as it, together with age and sex, provides an initial direction for planning and the mechanical approach to be used.
In short, ignoring this concept could lead to counterproductive procedures or instability after treatment. Below we find the five cephalometric values that we use to define our facial biotype.

Cephalometric measurements used to define vertical facial pattern (VERT index) analysis.
- 1, Facial axis 90 ±3 degrees.
- 2, Facial depth 87 ±3 degrees.
- 3, Mandibular plane 26 ±4 degrees.
- 4, Lower facial height 47±4 degrees.
- 5, Mandibular arch 26 ±4 degrees.
A Bi-dimensional image is the basis of cephalometric analysis in orthodontics and orthognathic surgery. Currently, cone beam computed tomography (CBCT) images can also be used for this purpose, with the advantage of not magnifying or distorting anatomical structures. To achieve this, several specific software programs have been developed to assist orthodontists and orthognathic surgeons in obtaining 3D cephalometric images, such as Nemotec among others. However, below we will show in a traditional and simple way how to obtain the biotypology index if you do not have specialized software.
VERT index step by step
1. FACIAL AXIS
Draw a line joining the Ba (basion) and N (nasion) points. fig A . Increase the image thickness to obtain a second image with a similar characteristic to a teleradiography and adjust the contrast of the image.
Draw a line in the superior-posterior region of the pterygopalatine fossa (Pt) to the most anterior and inferior points of mandibular symphysis Gn (point Gnatio) fig B, and measure the angle formed by these two lines fig C
2. FACIAL DEPTH
Draw a line in the region of the Frankfurt plane (plane passing the
porion (Po) to the inferior margin of the orbit (Or). fig D . Face plane: Draw another line from the nasion (N) to the most anterior point of the mandibular symphysis – Pog (Pogonion point) fig D
Measure the internal angle formed by intersection Frankfurt plane and Face plane
3. MANDIBULAR PLANE
Draw a line tangent to the base of the mandible (mandibular plane) and another line tangent to the most superior-posterior region of the pterygopalatine fossa (Pt) fig E .Draw another line parallel, which will be used as a reference line to the Frankfurt plane (Po-Or), and then displace it vertically in order to intersect with the anterior lines. fig E . Measure the internal angle in the region of the base of the mandible.
4. LOWER FACIAL HEIGHT
Draw a horizontal and vertical reference line to get the most central point of the mandible ramus (Xi) .Trace a line from the anterior nasal spine (ANS) to the central point of the mandible ramus (Xi) fig F. .Axis of the mandible’s body: Trace another line from mental protuberance (Pm) to the central point of the mandible ramus (Xi) fig G . Measure the internal angle formed by these two lines.


5.MANDIBULAR ARCH
Condylar Axis: Draw a line coming out of the posterior region of the condyle (DC) until Xi.
Measure the angle of intersection between the condylar axis (DC-Xi) and the prolongation of the axis of the mandible’s body (Pm-Xi). fig H

Now after having obtained our values of the aforementioned cephalometric factors, we proceed to tagged each one as negative or positive in reference to the norm and its standard deviation.
Deviations towards the dolichofacial pattern have a negative (-) sign and deviations in the brachyfacial direction have a positive(+) sign. Those that remain within the norm will be assigned zero (0).
Let’s talk about these specific cephalometric measurements and their appearance depending on the biotype and how to interpret it.
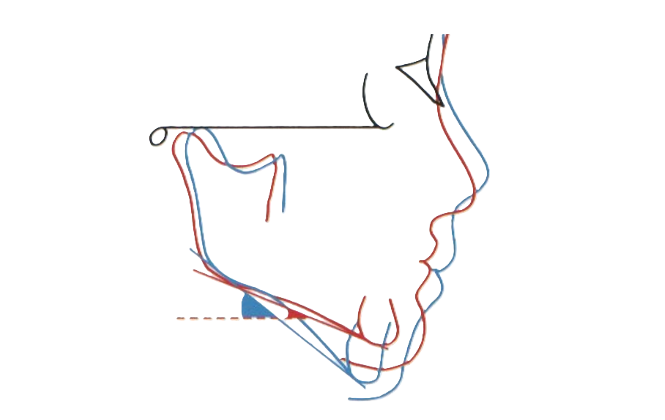
Facial Axis
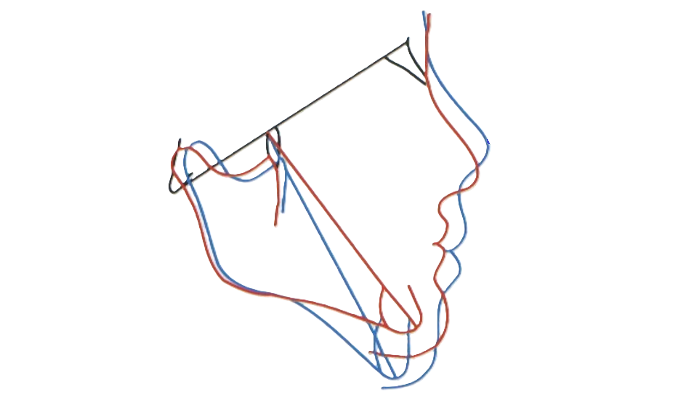
The facial axis represents the directional rotation pattern of mandibular (chin) growth and remains essentially stable throughout normal craniofacial development. Consequently, any significant deviation from this axis is most likely attributable to therapeutic intervention.
An angle greater than 90° indicates that the growth direction is more forward (horizontal/ Barchy) we tag as (+). When the angle is less than this value, the growth is considered to follow a more vertical ( Dolicho) patter , Tagged it ( -).
In advance we can said that the mechanical maneuvers that result in opening of the facial axis include: • Distalization of molars
• Extrusion of posterior teeth
The facial axis can be closed through:
• Intrusion of molars
• Mesialization of posterior segments These concepts will be further analyzed in the Treatment Planning section.
Facial Depth
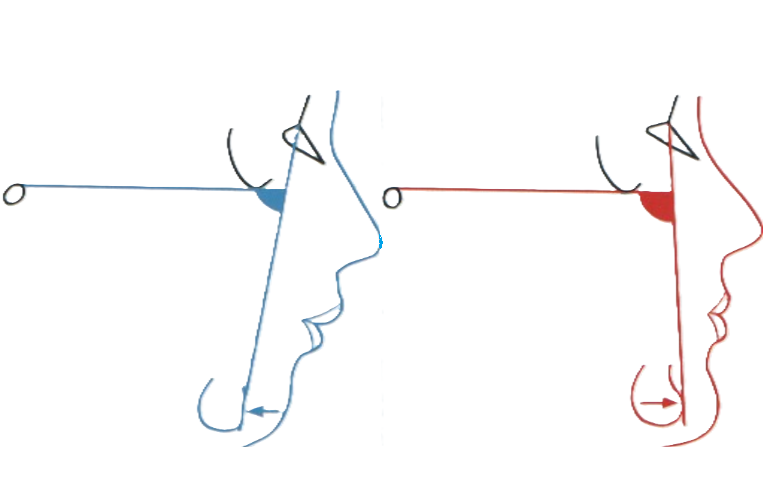
Indicate the sagittal position of point Po. The clinical norm is 87° ± 3°.
This angle increases with growth—approximately 1° every 3 years.
The age-related change is due to the differential growth rates of the anterior cranial base (CC–Na), which grows at 0.8 mm/year, compared to the mandibular body (Xi–Pm), which grows at 1.6 mm/year.
As a result, in adults, the normative value is approximately 90°Values below the norm indicate a dolichofacial biotype (we tag as -), while higher values correspond to a brachyfacial pattern (tagged as +).
Mandibular Plane
The normative value is 26° ± 4°. This measurement indicates the inclination of the mandibular body, and its value depends on the shape and spatial position of the mandible within the craniofacial complex. When this angle exceeds the normative range, it typically indicates a dolichofacial (-) pattern, often associated with ‘weak’ musculature and a predisposition to open bite.
Conversely, lower values are characteristic of a brachyfacial (+) pattern, associated with stronger musculature and a tendency toward deep bite.
This measurement decreases by approximately 1° every three years until adulthood, as a result of the archial growth pattern of the mandible.
Lower Facial Height
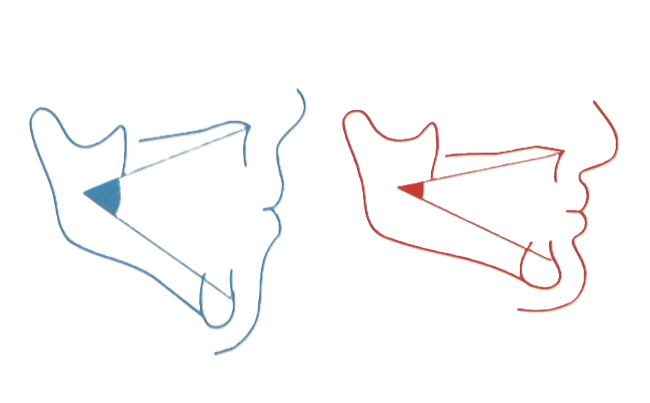
The normative value is 47°, with a clinical deviation of ±4°.
This is a gnomic measurement, similar to the facial axis, and therefore does not change with age.
Any variation in its value should be attributed to treatment effects. All mechanical interventions that tend to open the facial axis will also increase lower facial height, and vice versa. An angle greater than the norm indicates a divergent relationship between the mandible and the maxilla, typically associated with a dolicho pattern (-).
Conversely, lower values suggest a brachy pattern (+).
Mandibular Arch
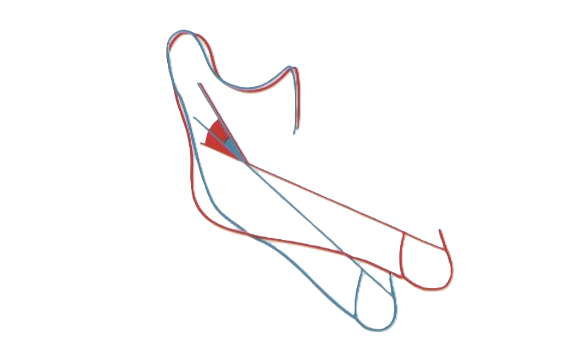
The normative value is 26° ± 4°, and it decreases by approximately 0.5° per year.
This reduction is attributed to slight morphological changes in the mandible resulting from archial (rotational) mandibular growth. An angle greater than the norm reflects a strong, square-shaped mandible, characteristic of a brachyfacial (+) growth pattern.
In contrast, a lower angle indicates a short mandibular ramus, a more obtuse mandibular shape, and a vertical dolichofacial (-) growth tendency.
Guide to interpreting VERT index
|
Severe Dolichofacial ← -2,0 |
Dolichofacial
-1,9 ↔ -1 |
Soft Dolichofacial -0,9 ↔ -0,5 |
Mesofacial..
-0,4 ↔ +0,4
|
Brachyfacial
+0,5 ↔ +0,9 |
severe Brachyfacial +1,0 → |
,,,
Next ,the normative value is subtracted from the patient’s measured value, the value obtained is accompanied by the corresponding sign (+ or -) . Then divide the patient’s value by the standard deviation of the analyzed measurement.
Finally, the algebraic sum of the obtained values is calculated and divided by 5—the number of variables analyzed—to obtain the average. This result represents the patient’s VERT index, which is then compared to the normative values established by Ricketts.(guide found above).
Taking the above into account, let’s take a hypothetical patient and determine their facial biotype using the VERT index.
-
- 1, Facial axis ————————–90° Normale (0)
- 2, Facial depth —————————- 83° Deviation toward Dolicho ( -)
- 3, Mandibular plane ———————25° Deviation toward Brachi (+)
- 4, Lower facial height ——————-43° Deviation toward Brachi (+)
- 5, Mandibular arch ———————–35° Deviation toward Brachi (+)
So we know that the norm of lower facial height is 47° and our patient has 43°, a tendency towards a closed angle (brachy), we will label it (+). In this way we continue factor by factor
(Patient value – Norm) ÷ standard deviation
- 1, Facial axis —————————— (90 – 90) ÷ 3 ——————- 0
- 2, Facial depth ————————— (83 – 87)÷ 4 ——————– -1,3
- 3, Mandibular plane ——————– (25 – 26) ÷ 3——————– +0,2
- 4, Lower facial height ——————- (43 – 47 ) ÷ 4 —————— +1
- 5, Mandibular arch ———————– (35 – 26) ÷ 4——————- +2,2
Algebraic sum 0.00+(−1,3) + (+0.2) + (+1 )+ (+2.2) =− +2,1 ÷ 5 = + 0,4 BRACHIFACIAL
Thus, index is obtained from an average measurement of the above five factors as described. This calculation can be performed using the standard values for patients aged 9 years. For greater accuracy, norms can be individualized according to the patient’s age. This adjustment is applied to those biotype measurements that change with growth, as the normative values undergo slight variations.
We highlight that the present step by step can be performed by any CBCT imaging software. Dentists of any specialty, as well as under-graduate students who are in the process of learning, can use it.
In addition, educational institutions and research that does not have access to software available in the market that allow the cephalometric analysis can obtain good results with this method as shown in the present study process of learning, can use it.